This is a final write up of our project.
Final Paper
Leave a reply
This is a final write up of our project.
This is a writeup of everything we’ve discovered so far:
When we previously did linear SVM classification between ethnic groups, we found that any two ethnic groups can be perfectly separated. The issue with this finding is that it may be possible to do this with any groups of points of similar size, as the dimension of the space is much larger than the number of points. Prof. Arora suggested that we look at the using the lasso penalty instead in order the number of components used in the separating hyperplane.
The standard approach when using an SVM is to minimize an error function subject to a constraint (ex: l2 norm of w is bounded). The problem with this approach is that sometimes we want components of w to go to 0, but this constraint never forces components to go to exactly 0.
However, if we use the l1 norm instead, the extremal points of our feasible region will have components set to exactly 0.
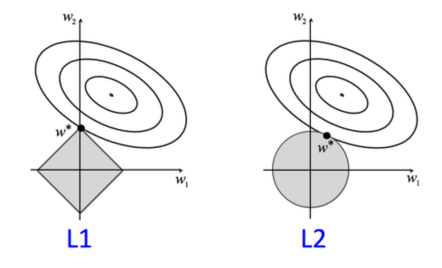
(image taken from Vibhav Gogate’s slides at http://www.hlt.utdallas.edu/~vgogate/ml/2014f/lectures/lr-nb-lec6.pdf)
It’s also possible to tune the upper bound on the l1 norm. Essentially, the smaller we make the l1 norm bound, the more components go to zero.
In the following graph, we are increasing the upper bound on the l1 norm along the x axis, while the importance of specific components is plotted on the y axis. Each allele is given a different color.

Our general findings were that we can still perform good classification by only looking at a small subset of the alleles. The following graph shows how our separating hyperplane improves as we allow more nonzero components.

Removing the least common 80% of alleles:

Removing the most common 20%:

Interestingly, the dense regime seems to carry less separating information.
Even if we only keep the bottom 20% of alleles by count:

This week, we found a few papers on the specific problem of genome compression. It seems like all the current work in this field focuses on lossless compression, and there don’t seem to be many close ties to machine learning.
The key idea in lossless compression is to take advantage of the fact that the genome sequence of any individual only differs from a reference genome in less than 1% of spots. (Note: throughout this project, we’ve been implicitly taking advantage of this idea by only looking at data from 1000 Genomes on SNP.) So one still needs to store a large copy of a reference genome in order to recover the original sequence data, but the hope is that this cost is “amortized” over many individual genomes.
However, simply storing the coordinates of each SNP requires a lot of space, since the numbers themselves grow quite large. The standard technique in this area is to use reference coordinates so that all the SNPs are listed in order along each chromosome, each with a number indicating the distance from the last SNP.
Once this is done, most methods use Huffman coding to take advantage of high levels of non-randomness in the human genome. These steps are outlined in the paper
http://bioinformatics.oxfordjournals.org/content/25/2/274.full.pdf+html
and are sufficient to achieve a 1000-fold compression (compressing James Watson’s 4GB genome sequence file down to a 4MB file). Other papers have used more specific knowledge about the human genome to improve upon this result. For example, the authors of
were able to get Watson’s genome down to 2.5 MB.
Our hope is that we might be able to combine lossy compression methods we find with these lossless methods and push this size down much further.
I. Dense vectors are densest in information
Suppose we want to discard some of our dimensions (or at least defer their consideration for a higher-granularity pass). If we keep the “dense” alleles, we are doing something similar to PCA. Indeed, this is supported by looking at principal components by frequency permutation:

II. Sparse vectors are also useful but much cheaper to store
But the SVM normal vectors suggest that low-frequency alleles also carry useful information in classifying between ethnic groups. If we store more of these components, in some sparse form, can we get the same amount of discriminating information with fewer bits?
Possible preliminary experiment: set the entries of some of the SVM normal vectors to 0 (the dimensions we wish to truncate). See if we still can still recover our great classification results.
III. Projecting onto a basis of SVM vectors
Hypothesis: alleles useful in discriminating between ethnic groups are also generally more useful in predicting other phenotypes.
If this holds true, then we can try the following procedure:
We relabel the alleles by their counts, as the original genome compression paper does. This seems to be a good heuristic for permuting the alleles such that data with more similar roles/properties cluster together. We already saw in the previous plot that more frequent alleles were more responsible for distinguishing between ethnic groups.
In this order, the data bitmap looks like this (y = individuals, x = alleles in order of frequency, white/grey/black = 00/01/11):

Variant counts in the same order (that is, simply the sorted count array):

Same plot with logarithmic y-axis:

A look at the absolute values of components of one separating normal (JPT-ACB) in this order (interpret this as the allele’s importance in classification):

Observations:
Ideas:
A linear SVM does exceptionally well at the ethnic group classification problem. For each pair of ethnic groups, there is a separating hyperplane with very large margin. Here, the x-axis is the dot product of a data point with the normal of the max-margin separating hyperplane (y is arbitrary):

Even when the first few principal components fail (between, say, ethnic groups that diverged more recently or have had more recent crossover), SVM classification yields very consistent results:

The normal vectors of these separating hyperplanes are also quite well-separated. Here, the x-axis is dot product with the JPT-ACB separator normal, and y-axis the GBR-PEL. Evidently there is a slightly correlation, but it is very far from degenerate:

Idea: project the vectors onto a basis formed by these vectors. They look like this (sorted by variant allele frequency). Qualitatively, we can see that different alleles distinguish between different ethnic groups, but the more common alleles reliably have a greater role (larger components along separating hyperplanes).

Spectral clustering fails, even between two well-separated groups, on LZW compressed data:

This suggests a bit of a dead end for our approach of embedding genomes into a feature space induced by a standard text compression algorithm; the distinguishing features of genomes do not follow the structure/statistics of text. This idea may be salvageable, however, if we instead directly consider the base sequences (or triplets of them): redundancy of substrings has a more sensible interpretation there. This may not work either; compression may simply capture the statistics of the genetic code, and we may not be able to isolate features that distinguish between individuals.
Next step: consider a custom compression scheme. Use primitives like delta encoding, run-length encoding, and entropy coding, combined with some preprocessing and domain knowledge.
Last week we posed the following toy problem:
Can we compress genome data and recover the ethnic groups in unsupervised learning?
We got the idea for this problem from this paper:
Click to access compressionAndVectors.pdf
which we’ve blogged about before. To quickly re-summarize, this paper talks about how data compression schemes can be used as a sort of dimensionality reduction in machine learning problems. The paper applies four common data compression schemes to strings of unix commands and then runs nearest neighbors clustering, and finds that these methods work as well as common vector space methods.
We’re trying to do the same thing here with genome data, but it’s a little bit tricky to decide what exactly our “strings” are. We ended up making our “strings” by doing the following:
For this week, we did this with just 5000 alleles, so each person was assigned a 5000 character string. We had small issues getting a compression based technique to work before class, so we simply ran PCA on this data and reduced it down to 2 dimensions.
We found ethnic group data on the 1000 genomes project, and were able to label each person with an ethic group according to the following table:
http://www.1000genomes.org/faq/which-populations-are-part-your-study


We made the following plots:
British in England and Scotland, Luhya in Webuya, Kenya

Utah Residents with Northern and Western European Ancestry, British in England and Scotland

Mexican Ancestry from Los Angeles, USA, Iberian Population in Spain

Japanese in Tokyo, Japan, African Caribbeans in Barbados

Southern Han Chinese, Japanese in Tokyo, Esan in Nigeria

Han Chinese in Beijing, Southern Han Chinese

British in England and Scotland, Finnish in Finland, Toscani in Italia

